Seeing double requests in your access log for HTTP authentication with status codes 401 and 200? Read further..
In this blog I will show you how to control the basic HTTP authentication flow with Oracle SOA Suite.
When we implement some sort of HTTP authentication, like the commonly used Basic Authentication, we have to deal with the standard HTTP Challenge/Response Authentication Framework. This means that whenever a client request is sent to the server, the server can challenge the client by sending a request back to provide authentication details. This request is accompanied by an HTTP status 401 Unauthorized and a WWW-Authenticate header which includes at least one authentication challenge. The client then repeats the request providing the credentials in the Authorization header to the server. If the credentials are correct, the server responds with the requested data and an HTTP status code 200 OK.
The diagram below shows how this works:

Source: https://developer.mozilla.org/en-US/docs/Web/HTTP/Authentication
We can actually see this flow in practice using SoapUI to call a web service that is secured with basic authentication. Using an HTTP traffic sniffing tool like Fiddler we can see the data being sent back and forth. Setup your SoapUI first by making sure the check box "Authenticate Preemptively" is not checked.

When submitting a request make sure you've added the credentials for Basic Authorization. Because we disabled the "Authenticate Preemptively" feature just now, we will select the "Use global preference" option.

In Fiddler we can now identify two responses when a request is submitted.The first one is the 401:

We can see that along with the status code 401 Unauthorized the WWW-Authenticate header is being sent. It tells us that Basic Authentication is used and the security realm is "owsm".
In the next request we provide these details in the header: "Authorization: Basic <base64 encoded credentials>". As these credentials are correct, an HTTP status code 200 OK is returned.

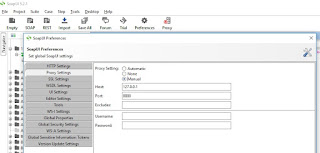
If you don't see anything logged in Fiddler, try adding the following proxy settings to SoapUI:
In the access log of the HTTP server we can see these responses as follows:

This kind of authentication is also called "reactive" authentication. Now that we know how HTTP authentication works, we can imagine that those extra calls to the server brings extra load on the network. Luckily, as opposed to reactive authentication, there is also something called "pre-emptive" authentication. In this type of authentication the authentication challenge is skipped. This means the credentials are provided directly in the first request to the server. This also means a successful request with HTTP status code 200 HTTP is not preceded by a status code 401 Unauthorized. This way we can reduce the number of requests to the server.
We can easily implement this in SOA Suite. Just add the following property oracle.webservices.preemptiveBasicAuth to the binding of your external service and set it to "true". This will enable pre-emptive authentication.

This property can also be changed run-time via the Enterprise Manager. To do so, navigate to your SOA Composite and then to the Service/Reference Properties for your service. In the right upper corner you can change the settings.

When our BPEL service now calls the external service with Basic Authentication no challenge is needed and the Authorization header is sent directly:

And the access log doesn't contain the 401 results anymore, keeping it clean and tidy:

In this blog I will show you how to control the basic HTTP authentication flow with Oracle SOA Suite.
When we implement some sort of HTTP authentication, like the commonly used Basic Authentication, we have to deal with the standard HTTP Challenge/Response Authentication Framework. This means that whenever a client request is sent to the server, the server can challenge the client by sending a request back to provide authentication details. This request is accompanied by an HTTP status 401 Unauthorized and a WWW-Authenticate header which includes at least one authentication challenge. The client then repeats the request providing the credentials in the Authorization header to the server. If the credentials are correct, the server responds with the requested data and an HTTP status code 200 OK.
The diagram below shows how this works:

Source: https://developer.mozilla.org/en-US/docs/Web/HTTP/Authentication
We can actually see this flow in practice using SoapUI to call a web service that is secured with basic authentication. Using an HTTP traffic sniffing tool like Fiddler we can see the data being sent back and forth. Setup your SoapUI first by making sure the check box "Authenticate Preemptively" is not checked.

When submitting a request make sure you've added the credentials for Basic Authorization. Because we disabled the "Authenticate Preemptively" feature just now, we will select the "Use global preference" option.

In Fiddler we can now identify two responses when a request is submitted.The first one is the 401:

We can see that along with the status code 401 Unauthorized the WWW-Authenticate header is being sent. It tells us that Basic Authentication is used and the security realm is "owsm".
In the next request we provide these details in the header: "Authorization: Basic <base64 encoded credentials>". As these credentials are correct, an HTTP status code 200 OK is returned.

If you don't see anything logged in Fiddler, try adding the following proxy settings to SoapUI:

In the access log of the HTTP server we can see these responses as follows:
This kind of authentication is also called "reactive" authentication. Now that we know how HTTP authentication works, we can imagine that those extra calls to the server brings extra load on the network. Luckily, as opposed to reactive authentication, there is also something called "pre-emptive" authentication. In this type of authentication the authentication challenge is skipped. This means the credentials are provided directly in the first request to the server. This also means a successful request with HTTP status code 200 HTTP is not preceded by a status code 401 Unauthorized. This way we can reduce the number of requests to the server.
We can easily implement this in SOA Suite. Just add the following property oracle.webservices.preemptiveBasicAuth to the binding of your external service and set it to "true". This will enable pre-emptive authentication.

This property can also be changed run-time via the Enterprise Manager. To do so, navigate to your SOA Composite and then to the Service/Reference Properties for your service. In the right upper corner you can change the settings.

When our BPEL service now calls the external service with Basic Authentication no challenge is needed and the Authorization header is sent directly:

And the access log doesn't contain the 401 results anymore, keeping it clean and tidy:


